Regions
On this page:
- Queenslanders’ vision for our regions
- Why regions is a foundation
- Spotlight on our regions
- What Queenslanders want
- Achieving success
- Get involved
Queenslanders’ vision for our regions
In 2044, our strong and diverse regional economies will support communities where people live, work and raise families. Our regions will balance and preserve liveability with robust, sustainable economic growth. They will be centred on towns and cities with growing populations that attract new residents to their enviable lifestyles and opportunities for growth. Reliable and accessible infrastructure will connect our regions with one another, the nation and the world. We will capitalise on the unique attractions of our regions and promote the growth of niche industries and local talents. Each of our regions will discover and develop their distinctive character, culture and heritage.
Why regions is a foundation
Our regional centres are the strongest in the nation and critical hubs for our growing industries. Read more on page 35 of The Queensland Plan.
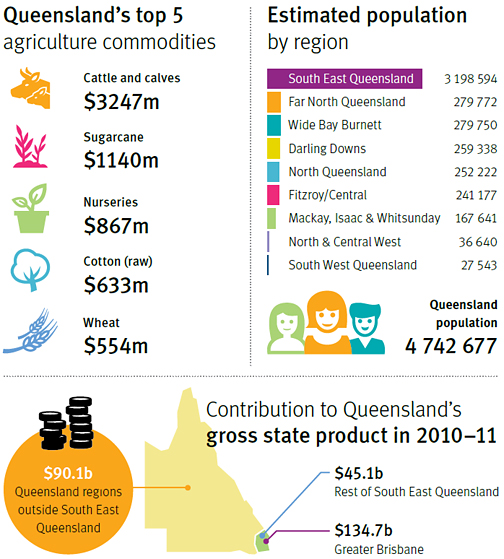
Spotlight on our regions

What Queenslanders want
The following goals highlight what Queenslanders said they wanted to be, do or achieve (in relation to this foundation). These goals are accompanied by the outcomes Queenslanders said they want to see. Read detailed descriptions of success factors in The Queensland Plan.
| Goal | What does success look like? |
|---|---|
G8 |
Our regions are prosperous and liveable. |
| Centres of excellence attract highly skilled labour and drive innovation*. | |
| Local decision-making drives regional development. | |
| G9 We capitalise on unique regional opportunities and assets. |
Regions have strong, diverse economies. |
| Regional development and service delivery reflects the needs of that region. | |
| G10 Working together we will achieve more. |
Regions collaborate productively. |
| We are the number one reliable and safe food bowl of Asia. | |
| G11 We value and invest in local businesses and workers. |
We have a range of employment choices. |
*A top 10 priority identified by delegates at the Brisbane Summit.
Achieving success
The following targets and measures will help focus our efforts towards achieving success. The baselines have been sourced from existing data sets as a starting point for future reporting. Download The Queensland Plan for a detailed explanation of what the measures show.
T7 Liveable regions
All Queenslanders are highly satisfied with the liveability* of their region.
T8 Growing regions
Double the regional population outside South East Queensland.
*Liveability includes dimensions of safety, prosperity, sense of community, opportunity and work–life balance.
| Primary measure | Starting point or baseline | ||||||||||||
|---|---|---|---|---|---|---|---|---|---|---|---|---|---|
Regional populationEstimated resident population by region. Source: Queensland Treasury and Trade, unpublished estimates. Source: ABS 3218.0 (2013), Regional Population Growth, Australia, 2012-13. |
4,742,677 Queensland population. Baseline: Queensland’s estimated resident population, as at 30 June 2013. See Spotlight on our regions infographic for a population breakdown by region. |
||||||||||||
Population growthAnnual percentage growth in population by South East and regional Queensland. Source: ABS 3218.0 (2014), Regional Population Growth, Australia, 2012–13.
|
Baseline: Regional population growth rates over the year to 30 June 2012. |
||||||||||||
Regional liveabilityPercentage of Queenslanders who are satisfied with the liveability of their region. Source: State survey.
|
Baseline to be created for 2014–15 through state survey. |
||||||||||||
Industry diversificationTop five industries of employment by region. Source: ABS, Census of Population and Housing (2011).
|
Baseline: Queensland’s top five industries by total employment, 2011 and available by region. |
| Secondary measure | Starting point or baseline | ||||||
|---|---|---|---|---|---|---|---|
Regional economyAverage annual percentage growth in gross state product. Source: Queensland Treasury and Trade (2014), Queensland State Accounts.
|
4.1% gross state product growth. Baseline: Queensland gross state product over 12 months, 2012–13. |
||||||
Housing stressProportion of occupied private dwellings in the bottom two income quintiles paying 30% or more of total household income in rent or mortgage. Source: ABS, Census of Population and Housing (2011) unpublished data (Queensland Treasury and Trade derived).
|
18.0% households in bottom two income quintiles in mortgage/rental stress. Baseline: All Queensland-occupied private dwellings in the bottom two income quintiles experiencing housing stress defined as where more than 30% of gross household income goes toward either rent or mortgage payments, 2011, available by region. |
||||||
Community safetyRate of reported person, property and other offences. Source: Queensland Treasury and Trade (2014), unpublished data.
|
Baseline: Reported offences across Queensland per 100,000 person, 2012–13. Also available by region. |
||||||
Cost of livingSpatial price index for towns/cities within regions. Source: Queensland Treasury and Trade (2014), Index of Retail Prices in Queensland Regional Centres, 2013.
|
Baseline: Brisbane prices are taken as the base measure of 100. Prices are measured above or below this base. |
Return to the foundations landing page to understand the purpose of the targets and measures or to select another foundation area to learn about.
Get involved
There are many ways you can help achieve our vision. Visit our Get involved page to read a few suggestions related to each foundation area.


