Economy
On this page:
- Queenslanders’ vision for our economy
- Why economy is a foundation
- Spotlight on our economy
- What Queenslanders want
- Achieving success
- Get involved
Queenslanders’ vision for our economy
In 2044, Queensland will be the strongest, most diverse economy in Australia, and a key player in the Asian region. Success will come from making the most of what we have to offer, building upon our strengths and using innovation to diversify our industries. Our regions will be central to our prosperity, converting their unique strengths into opportunities that drive and sustain growth. All Queenslanders will enjoy a high standard of living, supported by a wide variety of employment opportunities. Unemployment will be at a record low and our workforce will be inclusive, making the most of local talent.
Why economy is a foundation
Our strong economy fuels growth across our regions and is responsive to global shifts and opportunities, particularly in the Asian market. Read more on page 43 of The Queensland Plan.
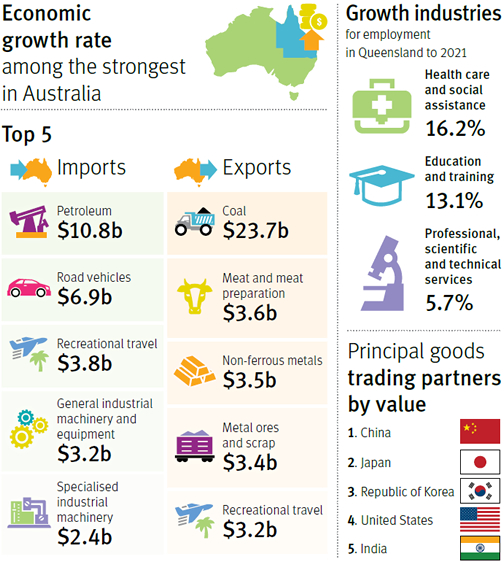
Spotlight on our economy
What Queenslanders want
The following goals highlight what Queenslanders said they wanted to be, do or achieve (in relation to this foundation). These goals are accompanied by the outcomes Queenslanders said they want to see. Read detailed descriptions of success factors in The Queensland Plan.
| Goal | What does success look like? |
|---|---|
| G12 We are the number one performing economy in Australia. |
We have a resilient economic system that can cope with global stress and threats. |
| We offer a diverse, competitive, contemporary business sector. | |
| G13 We are focused on industry development and diversification. |
We maximise opportunities in Asia. |
| We are recognised as internationally competitive, with strong exports/businesses, especially in the agricultural (food bowl) and ecotourism sectors.* | |
| Our businesses work together to innovate and embrace new opportunities. | |
| G14 Queensland has the best job opportunities in Australia. |
We have the highest productivity rate in Australia, with no skills shortages.* |
| Our unemployment rate is less than 5% | |
| G15 Our centres of excellence drive innovation. |
We are a global leader in innovative industry practices. |
| All regions have a centre of excellence for training, innovation and employment. | |
| Our education is technologically advanced—attracting foreign students. | |
| We invest and convert research into innovation.* |
*A top 10 priority identified by delegates at the Brisbane Summit.
Achieving success
The following targets and measures will help focus our efforts towards achieving success. The baselines have been sourced from existing data sets as a starting point for future reporting. Download The Queensland Plan for a detailed explanation of what the measures show.
T9 Growing prosperity
Queensland has the highest income, trade and employment growth in Australia.
T10 Bright ideas
Our brightest ideas have real social and economic benefits.
| Primary measure | Starting point or baseline | ||||
|---|---|---|---|---|---|
Income per capitaGrowth in real gross state domestic income (GSDI) per capita. Source: ABS 5220.0, Australian National Accounts: State Accounts.
|
GSDI per capita was $61,348. Baseline: Real GSDI per capita for 2012–13 expressed in 2011–12 dollar terms. Dollar value of the baseline will be adjusted annually to allow comparative growth calculation. |
||||
ExportsGrowth in international exports of goods and services. Source: ABS 5220.0, Australian National Accounts: State Accounts.
|
International exports were $66.1b. Baseline: Real international exports for 2012–13 expressed in 2011–12 dollar terms. Dollar value of the baseline will be adjusted annually to allow comparative growth calculation. |
||||
Credit ratingQueensland’s credit rating. Source: Standard and Poor’s (2013).
|
AA+ with a stable outlook Baseline: Queensland’s credit rating 2013. |
||||
Venture capitalLevels of venture capital investment compared to Australia. Source: ABS 5678.0 (2014), Venture Capital and Later State Private Equity, Australia 2012–13.
|
Baseline: Venture capital 2012–13. Queensland’s new and follow-on venture capital investment is second in Australia. |
||||
Employment growthEmployment growth compared to Australia. Source: ABS 6202.0 (monthly), Labour Force, Australia.
|
Baseline: 2012–13. |
| Secondary measure | Starting point or baseline | ||||||||||||||||
|---|---|---|---|---|---|---|---|---|---|---|---|---|---|---|---|---|---|
Unemployment rateUnemployment rate for Queensland persons 15 years and older. Source: ABS 6202.0 (monthly), Labour Force, Australia.
|
6.0% Queensland’s unemployment rate. Baseline: Queensland’s unemployment rate for persons aged 15 years and older, 2012–13. |
||||||||||||||||
Labour force participation rateLabour force participation rate for Queensland persons 15 years and older. Source: ABS 6202.0 (monthly), Labour Force, Australia.
|
66.1% of Queenslanders participate in the labour force. Baseline: Queensland’s labour force participation rate for persons aged 15 years and older, 2012–13. |
||||||||||||||||
Research and developmentBusiness expenditure on research and development in Queensland compared to Australia. Source: ABS 8104.0 (2013), Research and Experimental Development, Business, Australia 2011–12.
|
Baseline: Business expenditure on research and development, 2012–13. Queensland is fourth in Australia. |
||||||||||||||||
Return to the foundations landing page to understand the purpose of the targets and measures or to select another foundation area to learn about.
Get involved
There are many ways you can help achieve our vision. Visit our Get involved page to read a few suggestions related to each foundation area.